Kushan Empire: History, Rulers, Administration, Economy, Art, Decline
Population of Rajasthan 2026: Growth, Density, Literacy & Sex Ratio (Complete RAS Notes)

Get in Touch with RASonly!

Population of Rajasthan 2026 is a key topic for RAS Prelims and Mains, covering growth rate, density, sex ratio, and literacy trends based on Census 2011 data. This guide breaks down district-wise comparisons, including highest and lowest figures for population density, sex ratio, and literacy rate across Rajasthan. With simple, table-based explanations, it helps aspirants quickly revise crucial demographic facts frequently asked in RPSC exams, making preparation faster and more effective.

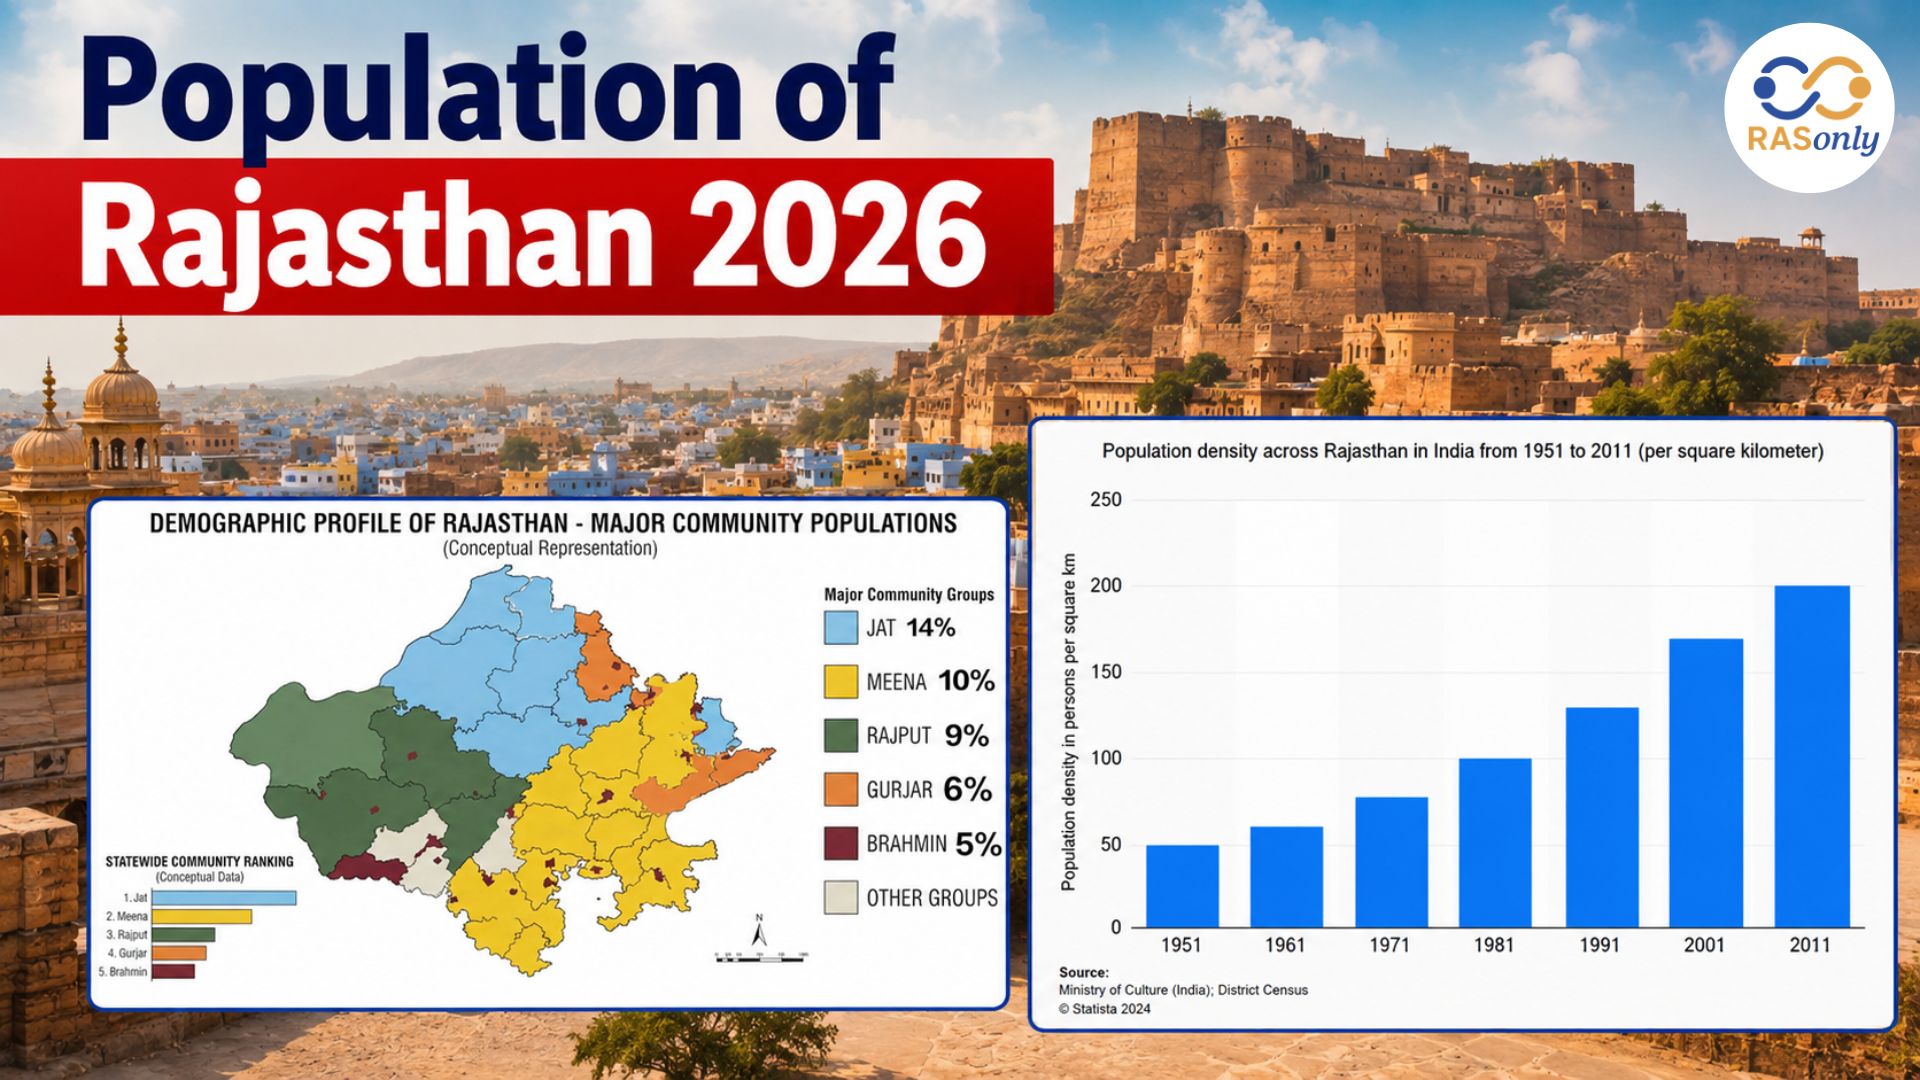
Understanding the Population of Rajasthan 2026 is one of the most important topics in Rajasthan Geography for RAS Prelims and Mains. Every year, questions from Population growth, density, literacy rate, and sex ratio appear in the RPSC exam, either directly or in the form of district-wise comparisons. This article covers the complete Rajasthan Population 2026 picture, based on Census 2011 (the last conducted census, since Census 2021 has been postponed), along with growth trends, density patterns, literacy data, and sex ratio figures, all explained in a simple, exam-oriented, table-based format.
Rajasthan is the largest state in India by area, covering 342,239 sq. km, which is 10.41% of India's total geographical area. However, in terms of population, it ranks much lower, which itself creates an important comparison point for exam questions. Let's understand every dimension of the Population of Rajasthan 2026 in detail.
Population of Rajasthan 2026: Overview
As per the last conducted Census (2011), Rajasthan had a total population of 68,548,437 (approximately 6.85 crore), making it the 8th most populous state in India at that time. Since the 2021 Census has been postponed and no fresh census has been conducted, the Population of Rajasthan 2026 is only available as an estimated/projected figure, based on the decadal growth rate of the state. As per current projections, the estimated population of Rajasthan in 2026 stands at approximately 8.5 crore, which would place Rajasthan around the 7th rank in population among Indian states today.
This distinction is important for RAS aspirants: the actual, verified Population of Rajasthan 2026 figure will only be confirmed once the next official census is conducted. Until then, all 2026 figures are estimates derived from the Census 2011 base data and the state's growth trend.
Quick Population Snapshot (Census 2011 vs Estimated 2026)
| Indicator | Census 2011 (Actual) | Estimated 2026 |
|---|---|---|
| Total Population | 6,85,48,437 (6.85 Crore) | ~8.5 Crore |
| Male Population | 3,55,50,997 | Estimated proportional rise |
| Female Population | 3,29,97,440 | Estimated proportional rise |
| % of India's Population | 5.66% | ~5.7% (estimated) |
| Rank in India | 8th | ~7th (estimated) |
| % of World Population | ~1% | ~1% |
The Population of Rajasthan 2026 also needs to be understood in context, Rajasthan holds 10.41% of India's total area but only about 5.66% of its total population. This mismatch between area share and population share is a favourite conceptual point in RAS Mains answer writing, as it directly relates to the state's low population density, which is discussed later in this article.
Rajasthan Population Growth Rate
Population growth refers to the increase in the number of inhabitants of a particular area over a particular period, and is calculated using the formula:
Population Growth = Total Births - (Total Deaths + Net Migration)
The Rajasthan population growth rate for the decade 2001–2011 was recorded at 21.31%, which is significantly higher than the national average growth rate of 17.70%. This decadal growth added around 1.20 crore people to the state's population within ten years.
Interestingly, in the entire 20th century, Rajasthan recorded a population decline only once during 1911–1921, largely due to famine and epidemic-related mortality.
District-wise Growth Rate Trends (2001–2011)
| Category | Details |
|---|---|
| Highest Population Increase (absolute numbers) | Jaipur district - 13.74 lakh |
| Lowest Population Increase (absolute numbers) | Bundi district - 1.48 lakh |
| Districts with growth rate 25% or above | Barmer, Jaisalmer, Jodhpur, Jaipur, Jalore, Dungarpur, Banswara |
Districts with Maximum Growth Rate vs Minimum Growth Rate
| Districts with Maximum Growth Rate | Districts with Minimum Growth Rate |
|---|---|
| Barmer - 32.5% | Sri Ganganagar - 10% |
| Jaisalmer - 31.8% | Jhunjhunu - 11.7% |
| Jodhpur - 27.7% | Pali - 11.9% |
| Banswara - 26.58% | Bundi - 15.4% |
This data is extremely important for RAS Prelims because RPSC frequently asks "which district recorded the highest/lowest growth rate" type of factual questions. Notice that desert districts of western Rajasthan (Barmer, Jaisalmer, Jodhpur) show the highest growth rates, while districts closer to the Punjab/Haryana border (Sri Ganganagar, Jhunjhunu) show comparatively lower growth an important regional pattern to remember.
Population Distribution: Rural vs Urban
Out of the total Population of Rajasthan 2026 base data (Census 2011), a large majority still resides in rural areas:
| Category | Population % | Actual Population |
|---|---|---|
| Rural Population | 75.13% | 5,15,00,352 |
| Urban Population | 24.87% | 1,70,48,085 |
The urban population of Rajasthan increased by 29.01% during 2001–2011, indicating a gradual but steady pace of urbanisation, which is expected to continue further by 2026. This rural-dominant structure directly influences literacy rates, sex ratio patterns, and density figures, since rural and urban areas show very different numbers for each of these indicators, as we'll see below.
Population Density of Rajasthan
Population Density refers to the number of persons living per square kilometre of area and is calculated as
Population Density = Total Population / Total Area
As per Census 2011, the population density of Rajasthan stands at 200 persons per sq. km, which is much lower than the national average density of 382 persons per sq. km. This was a rise from 165 persons per sq. km in 2001, an increase of about 35 persons per sq. km over the decade.
There are 18 districts in Rajasthan whose density is higher than the state average of 200. Interestingly, Sirohi (202) and Tonk (198) have density figures almost identical to the state average, making them a common "closest to state average" type exam question.
Regional Pattern of Density
- In the western and northern desert districts, density remains low due to arid climatic conditions, poor soil fertility, and scarce water resources.
- In the central hilly region, density is sparse because of rugged terrain.
- In the eastern and southern plain regions, density is significantly higher due to fertile land and better connectivity.
Districts with Maximum and Minimum Density
| Maximum Density (persons/sq. km) | Minimum Density (persons/sq. km) |
|---|---|
| Jaipur - 595 | Jaisalmer - 17 |
| Bharatpur - 503 | Bikaner - 78 |
| Dausa - 476 | Barmer - 92 |
| Alwar - 438 | Churu - 147 |
Jaipur district has the highest population density in the entire state at 595 persons per sq. km, while Jaisalmer district, being the largest district by area with a desert landscape, has the lowest density at just 17 persons per sq. km.
Change in Density (2001–2011)
| Districts with Highest Increase in Density | Districts with Lowest Decline in Density |
|---|---|
| Jaipur - increase of 124 points | Jaisalmer - decline of 4 points |
| Dausa - increase of 91 points | Bikaner - decline of 15 points |
| Bharatpur - increase of 88 points | Pali - decline of 17 points |
Districts with density less than 100 are Jaisalmer, Bikaner, and Barmer, while districts with density above 400 are Jaipur, Bharatpur, Dausa, and Alwar, both extremely important for objective-type RAS questions.
Rajasthan Sex Ratio
Sex Ratio indicates the number of females per 1,000 males, and is calculated as:
Sex Ratio = (Total Female Population × 1000) / Total Male Population
As per Census 2011, the sex ratio of Rajasthan stood at 928, which is 15 points lower than the national average of 943. This was, however, an improvement from 921 recorded in 2001, showing a continuous rising trend since 1991. Notably, no district in Rajasthan has a sex ratio of 1,000 or above, meaning males outnumber females in every single district of the state.
Regional Pattern
- Western and northern districts of Rajasthan show a sex ratio lower than the state average.
- Central and southern (tribal) districts show a sex ratio higher than the state average, the sex ratio in tribal-dominated districts tends to be consistently better than in non-tribal districts.
Districts with Highest and Lowest Sex Ratio (2011)
| Districts with Highest Sex Ratio | Districts with Lowest Sex Ratio |
|---|---|
| Dungarpur - 994 | Dholpur - 846 |
| Rajsamand - 990 | Jaisalmer - 852 |
| Pali - 987 | Karauli - 861 |
| Pratapgarh - 983 | Bharatpur - 880 |
| Banswara - 980 | Sri Ganganagar - 887 |
Interestingly, in the 2001 Census, two districts, Dungarpur (1022) and Rajsamand (1000) had recorded a sex ratio above 1,000, but both saw a decline by 2011.
Urban vs Rural Sex Ratio
| Area | Sex Ratio |
|---|---|
| Urban Rajasthan | 914 females per 1000 males |
| Rural Rajasthan | 933 females per 1000 males |
Child Sex Ratio (0–6 years)
The child sex ratio in Rajasthan for the 0–6 age group stood at 888 in 2011, considerably lower than the overall sex ratio of 928. This dropped from 909 in the 2001 Census a worrying trend of declining child sex ratio, which is a frequently discussed issue in RAS Mains answer writing on social/demographic challenges.
| Districts with Highest Child Sex Ratio | Districts with Lowest Child Sex Ratio |
|---|---|
| Banswara - 934 | Jhunjhunu - 837 |
| Pratapgarh - 933 | Sikar - 848 |
| Bhilwara - 928 | Karauli - 852 |
| Udaipur - 924 | Sri Ganganagar - 854 |
| Dungarpur - 922 | Dholpur - 857 |
Only three districts recorded an increase in child sex ratio compared to 2001: Sri Ganganagar (850 → 854), Hanumangarh (872 → 878), and Jaisalmer (869 → 874) - a useful fact for "exception to the trend" style questions.
Rajasthan Literacy Rate
Literacy Rate is defined as the percentage of people aged 7 years or above who can read and write. The literacy rate of Rajasthan as per Census 2011 stood at 66.11%, an improvement from 60.41% in 2001.
Literacy Rate Comparison (2001 vs 2011)
| Category | Census 2011 | Census 2001 | Growth |
|---|---|---|---|
| Total Literacy | 66.1% | 60.41% | 5.69% |
| Male Literacy | 79.2% | 75.7% | 3.5% |
| Female Literacy | 52.1% | 43.9% | 8.2% |
A key exam fact: the gender gap in literacy in Rajasthan is around 27%, which is the highest gender literacy gap among all Indian states. This makes the Rajasthan Literacy Rate topic a common source of Mains-level analytical questions on gender disparity in education.
Rajasthan vs India (Literacy Comparison)
| Indicator | Rajasthan (2011) | India (2011) |
|---|---|---|
| Total Literacy Rate | 66.1% | 73% |
| Male Literacy Rate | 79.2% | 80.9% |
| Female Literacy Rate | 52.1% | 64.6% |
| Work Participation Rate | 43.6% | 39.8% |
District-wise Literacy Rate
| Districts with Maximum Literacy | Districts with Minimum Literacy |
|---|---|
| Kota - 76.6% | Jalore - 54.9% |
| Jaipur - 75.5% | Sirohi - 55.3% |
| Jhunjhunu - 74.1% | Pratapgarh - 56.0% |
| Sikar - 71.9% | Banswara - 56.3% |
| Alwar - 70.7% | Barmer - 56.5% |
Male and Female Literacy: District Extremes
| Male Literacy - Maximum | Male Literacy - Minimum | Female Literacy - Maximum | Female Literacy - Minimum |
|---|---|---|---|
| Jhunjhunu - 86.9% | Pratapgarh - 69.5% | Kota - 65.9% | Jalore - 38.5% |
| Kota - 86.3% | Banswara - 69.5% | Jaipur - 64.0% | Jaisalmer - 39.7% |
| Jaipur - 86.1% | Sirohi - 70.0% | Jhunjhunu - 61.0% | Sirohi - 39.7% |
| Sikar - 85.1% | Jalore - 70.7% | Sri Ganganagar - 59.7% | Barmer - 40.6% |
| Bharatpur - 84.1% | Barmer - 70.9% | Sikar - 58.2% | Pratapgarh - 42.4% |
An interesting note: the literacy rate of Karauli district is almost equal to the overall Rajasthan literacy rate, making it a benchmark district often referred to in comparative questions.
Highest Increase in Literacy (2001–2011)
| District | Increase |
|---|---|
| Dungarpur | 10.9% |
| Banswara | 10.8% |
| Bhilwara | 10.75% |
| Tonk | 9.6% |
| Jodhpur | 9.2% |
On the other hand, Barmer (–2.5%) and Churu (–0.8%) were the only two districts that recorded a decline in literacy rate during 2001–2011, an unusual and exam-relevant exception.
Religious & Social Composition (Supplementary Data)
While studying the Population of Rajasthan 2026, it is also useful to understand the religious composition of the state as per Census 2011:
| Religion | Percentage |
|---|---|
| Hinduism | 88.49% |
| Islam | 9.07% |
| Sikhism | 1.27% |
| Jainism | 0.91% |
| Christianity | 0.14% |
| Others | Remaining % |
Additionally, the Scheduled Caste population of Rajasthan stands at 17.8%, slightly higher than the national average of 16.6%. Districts with the highest SC percentage are Sri Ganganagar (36.6%) and Hanumangarh (27.8%), while Dungarpur (3.8%) and Banswara (4.5%) have the lowest SC percentage, mainly because these are tribal-dominated districts with a high Scheduled Tribe population instead.
Key One-Liner Facts for Quick Revision (RAS Exam Special)
- Rajasthan holds 5.67% of India's total population and about 1% of the world's population.
- Rajasthan's rank in population as per Census 2011 was 8th; the current estimated rank is around 7th.
- The 2011 Census motto was "Our Census, Our Future," and it was the first paperless census; the census mascot was a Female Enumerator.
- Population Growth Rate (2001–2011): 21.31%, higher than India's average of 17.70%.
- Population Density: 200 persons/sq. km, compared to the national average of 382.
- Sex Ratio: 928, compared to the national average of 943.
- Child Sex Ratio: 888, lower than the overall state sex ratio.
- Literacy Rate: 66.11%, compared to India's 73%.
- Gender literacy gap: 27%, the highest among Indian states.
- Jaipur district tops in population, male/female population, and population density.
- Jaisalmer district has the lowest population density and among the lowest population figures.
Conclusion - Rajasthan Population 2026
The Population of Rajasthan 2026 is best understood as an evolving estimate built on the solid foundation of Census 2011 data, since no updated census has been conducted since then. For RAS aspirants, mastering the growth rate, density, sex ratio, and literacy figures along with their district-wise extremes is essential, as RPSC frequently tests this topic through both direct factual questions and analytical Mains questions on social development. Keep revising the tables above regularly, as district-wise "maximum vs minimum" comparisons are the most commonly asked pattern in RAS Prelims.
FAQs - Rajasthan Population 2026
As per projections based on Census 2011 growth trends, the estimated Population of Rajasthan 2026 is approximately 8.5 crore, since the next official census has not yet been conducted.
As per Census 2011, the population density of Rajasthan is 200 persons per sq. km, well below the national average of 382 persons per sq. km.
Jaipur district has the highest population density in Rajasthan at 595 persons per sq. km.
The sex ratio of Rajasthan, as per Census 2011, is 928 females per 1,000 males, lower than the national average of 943.
The overall literacy rate of Rajasthan as per Census 2011 is 66.11%, with male literacy at 79.2% and female literacy at 52.1%.
Kota district has the highest literacy rate in Rajasthan at 76.6%, followed by Jaipur at 75.5%.
Census 2021 has been postponed to logistical and administrative reasons at the national level, which is why the Population of Rajasthan 2026 remains an estimated figure rather than an officially confirmed one.

BEST SELLER
🏆 PRELIMS
RAS Pass
Prelims focused Hindi & English
₹399
✓
Prelims Topic-Wise Tests
✓
Subject-Wise Tests
✓
Full-Length Prelims Tests
✓
Daily Current Affairs Tests
✓
Prelims PYQs Tests
✓
Detailed Solutions & Analysis
✓
All Rajasthan Ranking
✓
Unlimited Reattempts
✓
Mains Tests
✓
Hindi & English Tests
✓
All Rajasthan Ranking
Trusted by 5,000+ Students
Post Category
- RAS Salary
- Result
- RAS Admit Card
- RAS Job
- RAS Cutoff
- Preparation Tips
- RAS Answer Key
- RAS Exam Analysis
- RAS Syllabus
- RAS Previous Year Papers
- RPSC RAS Exam Pattern
- RAS Interview
- RAS Exam Date
- RAS Vacancy
- RAS Test Series
- RAS Best Books
- RAS Preparation Resources
- RAS Coaching Centre
- History
- Polity
- Geography
- Economics
- Science
- Art and Culture
- RPSC RAS Application Form
- RPSC RAS Notification
- RAS Eligibility Criteria
- UPSC Exam
- RPSC RAS Mains
Visit Our RASonly Offline Center
Our Expert Faculty

Bhunesh Sir
Current Affairs · 13+ Yrs

Aamir Khan Sir
RAS-2017 · IIM Ahm.
Akash Sir
Polity · 8+ Yrs
Free Resources
Official Mobile App

RASOnly App
by OTSAdda · Free
Full Video Lectures
Mock Tests & PYQs
Daily Current Affairs
AI Mock Interview
Free Download · No subscription needed to install
RAS 2024 Toppers — RASonly
Rank 2
Virendra Charan
Rank 9
Bhoopinder Singh
Rank 26
Aanchal Nagpal
Rank 33
Lokendra Singh
Rank 45
Amar Rathore
Rank 46
Manasvini Verma

Join RASonly WhatsApp Community
Get daily current affairs, exam alerts, free study material and tips from expert faculty — right on WhatsApp.
Join for Free →RASonly Interview Guidance Program

Mr. Ashok Jain
Ex-Chief Secretary Govt of Rajasthan
- IAS officer of the 1981 batch, Rajasthan cadre.
- Passionate about mentoring the next generation of RAS officers with real-world insights.
- Got retired in Dec 2017 from the post of Chief Secretary of the state of Rajasthan.

Mr. Guru Charan Rai
Ex-ASP / SP in Jaisalmer
- Guru Charan Rai, IPS (Retd), retired as Inspector General of Police (Security), Rajasthan, Jaipur in 2017.
- Served as ASP and SP in Jaisalmer, Nagaur, Sri Ganganagar, Sawai Madhopur, Dausa, Sikar, and Karauli.
- He also held key positions as DIGP and IGP in the Law and Order division.

Mr. Rakesh Verma
Ex-IAS Officer, B.Tech, MBA, and M.A. (Economics)
- IAS officer of the 1981 batch and retired in Chief Secretary Rank.
- Civil servant of high repute and vast experience.
- Has been teaching UPSC CSE subjects for the last six years.

Daily Current Affairs for RAS Exam Preparation 2026

India Wins Gold in 10m Air Pistol
September 26, 2026
India’s Rank in Travel And Tourism Development Index 2026
September 26, 2026
India Wins Bronze Medal in Men’s Double Sculls
September 25, 2026